Grafana: Building a Dashboard for YouTube Channel Stats
YouTube Studio gives you analytics, but you're limited to their dashboards and their data views. Let's create a Grafana dashboard that pulls key data from my YouTube channel and displays exactly what we want. This was a weekend project for myself. I've been digging into the Boot.dev observability track this year and I wanted to create a self-driven project that utilized everything I was learning. Below I am going to outline the steps, considerations, details and tech that was used to make this dashboard. If you want to follow along and create your own version for your YouTube channel, this is all a local setup, and you can do it at zero cost.
Step 1: Setting Up Google Authentication
The first step — we need to get an account with permissions that can pull data from YouTube APIs. This will require you to set up a developer account with Google (you need an existing Gmail account to do this). You can set up the developer account for free at developers.google.com.
The YouTube Data API v3 runs on a quota system with a daily limit of 10,000 units. Not all API calls cost the same — a search request runs 100 units while a standard read like pulling channel or video stats costs just 1 unit. For our nightly pipeline we are making a handful of cheap read calls, so we barely make a dent in the daily quota. Even if you have a large channel with hundreds of videos you have plenty of runway here.
-
Create a Google Cloud Project
- Go to console.cloud.google.com
- Create a new project — name it something descriptive like
youtube-grafana-dashboard
-
Enable the API
- Navigate to APIs & Services → Library
- Search and enable YouTube Data API v3
-
Configure the OAuth Consent Screen
- Go to APIs & Services → OAuth Consent Screen
- Select External
- Fill in app name and your email
- Add scope:
youtube.readonly - Add your Gmail as a test user
-
Create OAuth Credentials
- Go to APIs & Services → Credentials → Create Credentials
- Select OAuth 2.0 Client ID
- Application type: Desktop App
- Note: Google no longer lets you download the JSON file directly — you'll need to manually create
client_secret.jsonusing the client ID and a newly generated secret (covered in Step 2)
Step 2: Setting Up the Python Pipeline
First, we are going to create a Python file and set up the authentication code to ensure we can programmatically access the YouTube APIs through the Google authentication we just configured.
-
Install the Required Libraries
For this project we need a set of Google libraries that will allow us to authenticate and make the necessary API calls:
google_auth_oauthlibgoogleapiclient(discovery, errors)google.oauth2.credentialsgoogle.auth.transport.requests
You can install them with the following command using command prompt or your IDE terminal:
bashpip install google-auth-oauthlib google-api-python-client -
Create the
client_secret.jsonFileWe need to manually create the
client_secret.jsonfile in your project folder with the following structure.Note: you don't want anyone else to have access to the information in this file.jsonclient_id— found under APIs & Services → Credentials → your OAuth client.client_secret— click Add secret on the credentials page and copy it immediately — it won't be shown again.{ "installed": { "client_id": "YOUR_CLIENT_ID.apps.googleusercontent.com", "client_secret": "YOUR_CLIENT_SECRET", "redirect_uris": ["http://localhost"], "auth_uri": "https://accounts.google.com/o/oauth2/auth", "token_uri": "https://oauth2.googleapis.com/token" } } -
Testing Authentication & Token Caching
We need to test that our authentication is working and we can hit the YouTube APIs. Google provides documentation and a way to test API calls and get boilerplate code. Go to the link below:
developers.google.com/explorer-help/code-samples#python
On the right side you will see an API Explorer. Select YouTube Data API v3 and click the Try this API button. Select a method — I started with
channels.list. In the top right you will see an icon that allows you to expand to full screen. After going into full screen, select Python as the language and you will have boilerplate code ready to copy into your IDE.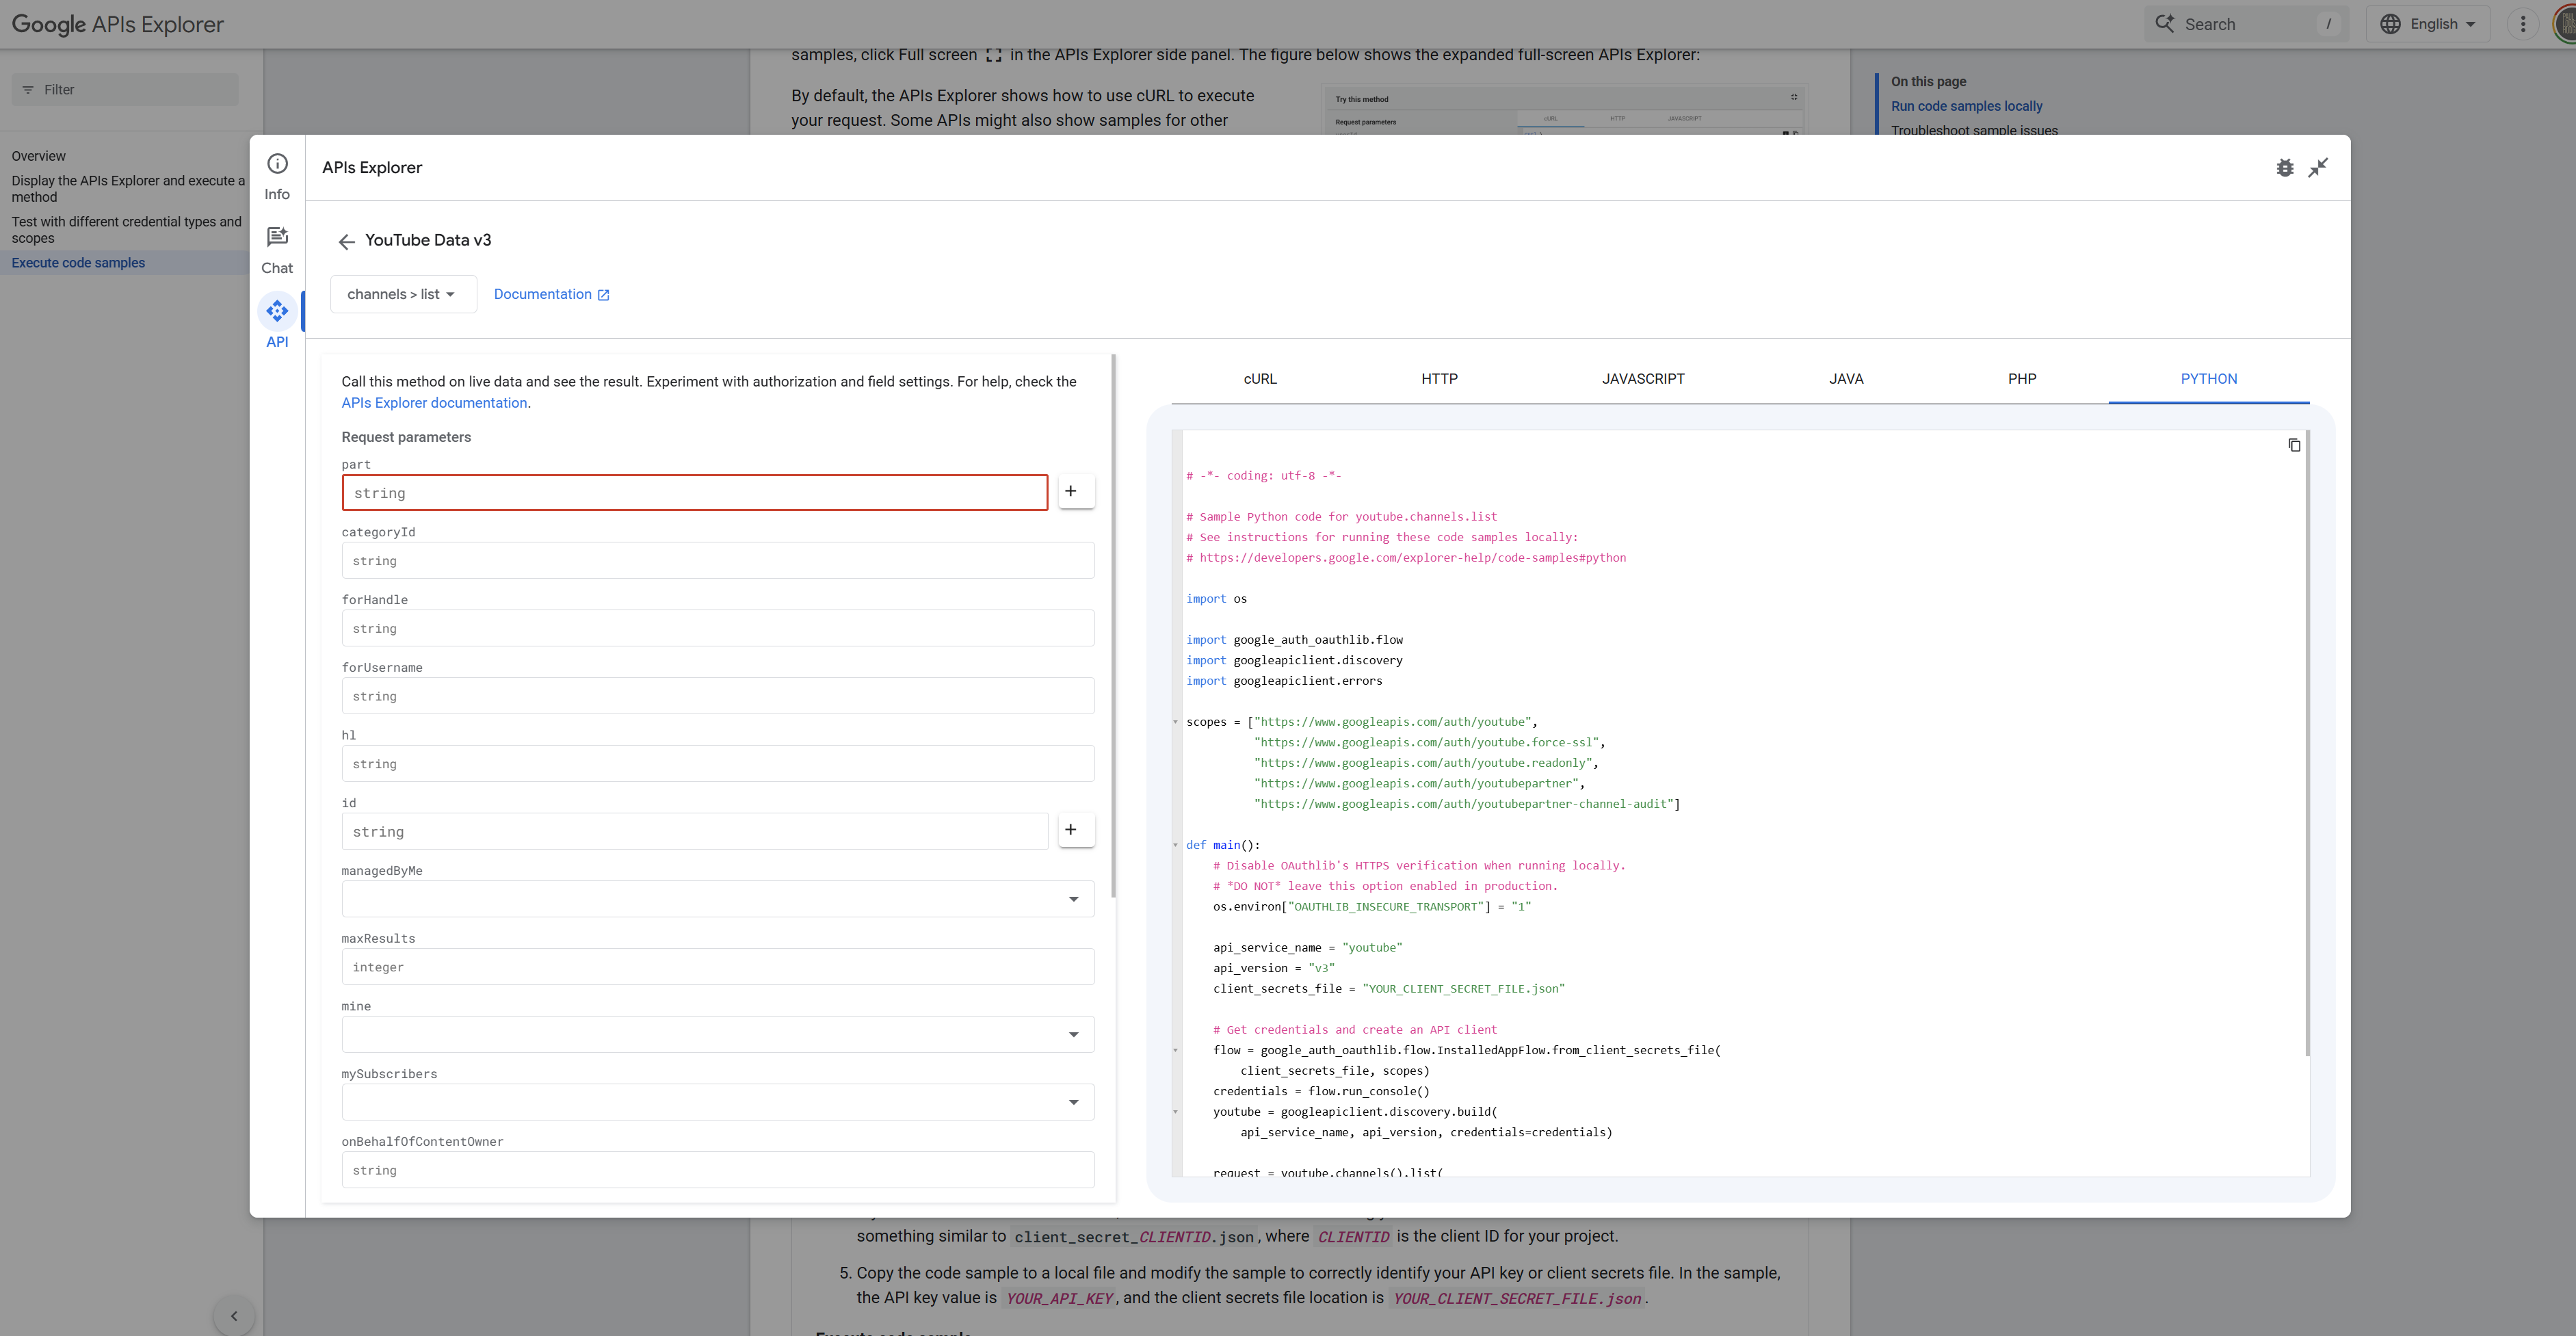
You can execute a test directly in the API Explorer by inputting your Channel ID, but when moving to our own Python code we need to make a few modifications:
- Change
run_console()torun_local_server(port=0) - Point
client_secrets_fileto the file we created above - Change the channel ID to your YouTube channel ID
Next, we address token caching. Without token caching, every time we authenticate we will be forced to log in through a popup window. To automate the API calls this is an absolute must.
pythonscopes = ["https://www.googleapis.com/auth/youtube.readonly"] os.environ["OAUTHLIB_INSECURE_TRANSPORT"] = "1" api_service_name = "youtube" api_version = "v3" client_secrets_file = "client_secret.json" TOKEN_FILE = "token.json" # Step 1 - check if token exists if os.path.exists(TOKEN_FILE): credentials = Credentials.from_authorized_user_file(TOKEN_FILE, scopes) # Step 2 - refresh if expired if credentials.expired and credentials.refresh_token: credentials.refresh(Request()) else: # Step 3 - no token, run browser flow flow = google_auth_oauthlib.flow.InstalledAppFlow.from_client_secrets_file( client_secrets_file, scopes) credentials = flow.run_local_server(port=0) # Step 4 - save the token for next time with open(TOKEN_FILE, "w") as token: token.write(credentials.to_json()) youtube = googleapiclient.discovery.build( api_service_name, api_version, credentials=credentials)In the code block above notice the
TOKEN_FILE = "token.json"reference. This file doesn't exist in our project folder until we execute our first run — it will be created automatically after the initial browser authorization. If the token file gets deleted, the script will recreate it.The script checks for
token.json. If it doesn't exist, a browser prompt handles the initial Google authorization and saves the token for future use. If it does exist, the token is validated and silently refreshed if expired. Once we have valid credentials, we build the YouTube API client and we are ready to make API calls.One note — if you open
token.jsonyou'll see it contains both anaccess_tokenand arefresh_token. The access token expires after one hour, but the refresh token is long-lived and allows the script to obtain a new access token silently on every run without going through the browser flow again. As long astoken.jsonexists with a valid refresh token, the script will run unattended indefinitely. - Change
Step 3: Fetching Data via the YouTube API
Once authentication is working it's time to make the API calls. The first call to youtube.channels().list grabs channel-level stats — subscriber count, total views, and video count. One important note here is that these values are returned as strings, so we cast them to integers before storing them.
request = youtube.channels().list(
    part="snippet,contentDetails,statistics",
    id=CHANNEL_ID
)
response = request.execute()

view_count = int((response['items'][0]['statistics']['viewCount']))
sub_count = int((response['items'][0]['statistics']['subscriberCount']))
video_count = int((response['items'][0]['statistics']['videoCount']))
Next, we need to pull stats for individual videos, but to do this we first need all of our video IDs. YouTube doesn't have a direct "give me all my videos" endpoint — instead, every channel has a system-managed uploads playlist that contains all published videos. We need to query that playlist to collect the IDs.
UC) and replacing the second character with a U (resulting in UU...).YouTube returns a maximum of 50 results per page, so for channels with more than 50 videos we need to handle pagination. The following function wraps the playlistItems.list call and accepts an optional page_token parameter:
def get_playlist_items(youtube, playlist_id, page_token=None):
    return youtube.playlistItems().list(
        part="contentDetails",
        maxResults=50,
        playlistId=playlist_id,
        pageToken=page_token
    ).execute()
We then run a simple loop. When there are more pages, the API returns a nextPageToken in the response. When no nextPageToken is returned, we know we've reached the last page and break out of the loop.
video_ids = []
page_token = None

while True:
    response = get_playlist_items(youtube, UPLOADS_PLAYLIST_ID, page_token)
    for item in response['items']:
        video_ids.append(item['contentDetails']['videoId'])
    if 'nextPageToken' in response:
        page_token = response['nextPageToken']
    else:
        break
Now that we have all video IDs, we can fetch stats for each one. The videos().list endpoint accepts multiple IDs in a single request, up to 50 at a time. We chunk our ID list into groups of 50 and pass each chunk to a function that makes the API call and parses the response:
all_videos = []
for i in range(0, len(video_ids), 50):
    chunk = video_ids[i:i+50]
    all_videos.extend(get_video_stats(youtube, chunk))
The chunk loop calls get_video_stats, which extracts the individual video data we need for our visualizations.
def get_video_stats(youtube, chunk):
    """Fetches video statistics for a chunk of video IDs."""
    ids_string = ','.join(chunk)
    response = youtube.videos().list(
        part="snippet,statistics",
        id=ids_string
    ).execute()

    videos = []
    for item in response['items']:
        videos.append({
            'video_id': item['id'],
            'title': item['snippet']['title'],
            'view_count': int(item['statistics']['viewCount']),
            'like_count': int(item['statistics'].get('likeCount', 0)),
            'comment_count': int(item['statistics'].get('commentCount', 0))
        })
    return videos
Note the use of .get('likeCount', 0) instead of direct key access — some creators disable likes on their videos, which means the field won't be present in the response. Using .get() with a default of 0 prevents the script from throwing a KeyError if a video has likes turned off.
Step 4: SQLite Installation & Setup
Now we need somewhere to store our data so Grafana can query it. For this project I'm using SQLite. SQLite is part of Python's standard library — setup is easy, we just need to add an import statement at the top of our Python file.
pythonimport os
import sqlite3
from datetime import datetimeWe are going to create two tables: one for channel stats and one for video stats. Channel stats will hold daily high-level channel snapshots like total views, while video stats will hold per-video metrics. The function below creates our database and tables. The key callout here is CREATE TABLE IF NOT EXISTS — this checks for the table in our database and only creates it if it does not exist, meaning on subsequent runs this step will be skipped. However, if our database gets deleted, this will recreate it.
def init_db():
    conn = sqlite3.connect('youtube_stats.db')
    cursor = conn.cursor()
    cursor.execute("CREATE TABLE IF NOT EXISTS channel_stats(timestamp, view_count, sub_count, video_count)")
    cursor.execute("CREATE TABLE IF NOT EXISTS video_stats(timestamp, video_id, title, view_count, like_count, comment_count)")
    conn.commit()
    conn.close()
After our database and tables are created, we need functions to insert the data collected by our API calls. A few things worth calling out:
datetime.now().isoformat()is what enables time series graphs in Grafana.- We also use a duplicate check before each insert by checking against the date:
SELECT 1 FROM video_stats WHERE video_id = ? AND timestamp LIKE ?On a normal nightly run this won't matter, but if you manually trigger the script multiple times in the same day, this prevents duplicate rows from being written. This will prevent visualizations like our Top 10 video panels from having duplicates that would pollute the results. We also use ? placeholder syntax for our insert values. This prevents SQL injection and is just good practice.
def insert_channel_stats(view_count, sub_count, video_count):
    timestamp = datetime.now().isoformat()
    today = datetime.now().date().isoformat()
    conn = sqlite3.connect('youtube_stats.db')
    cursor = conn.cursor()
    cursor.execute("SELECT 1 FROM channel_stats WHERE timestamp LIKE ?", (today + '%',))
    if cursor.fetchone() is None:
        cursor.execute("INSERT INTO channel_stats VALUES(?,?,?,?)", (timestamp, view_count, sub_count, video_count))
    conn.commit()
    conn.close()

def insert_video_stats(video_id, title, view_count, like_count, comment_count):
    timestamp = datetime.now().isoformat()
    today = datetime.now().date().isoformat()
    conn = sqlite3.connect('youtube_stats.db')
    cursor = conn.cursor()
    cursor.execute("SELECT 1 FROM video_stats WHERE video_id = ? AND timestamp LIKE ?", (video_id, today + '%',))
    if cursor.fetchone() is None:
        cursor.execute("INSERT INTO video_stats VALUES(?,?,?,?,?,?)", (timestamp, video_id, title, view_count, like_count, comment_count))
    conn.commit()
    conn.close()
Below we can see where these functions are called in our Python script. We have simple insert statements that take the data collected from our API calls and write it to our database. One thing worth noting — since the Python script writes to SQLite from Windows while Grafana reads it from inside Docker, there is a small chance of a database is locked error if both happen simultaneously.
insert_channel_stats(view_count, sub_count, video_count)
print("Channel stats inserted")

for video in all_videos:
    insert_video_stats(
        video['video_id'],
        video['title'],
        video['view_count'],
        video['like_count'],
        video['comment_count']
    )
print(f"Video stats inserted: {len(all_videos)} videos")
At this point the hardest part of our work is done — we have our Python script authenticating, calling the Google APIs, pulling down the data we want, and writing it to our SQLite database.
Step 5: Docker Setup (Optional)
For my setup I'm using Docker to run Grafana. Grafana can be installed directly on your local machine and run natively, which for a purely personal project might be simpler. That said, Docker gives us something more portable and reproducible, so I have selected to use it for my own project.
If you don't have Docker installed, you can download Docker Desktop for Windows or Mac at docker.com/products/docker-desktop/, or run it through WSL (Windows Subsystem for Linux). For this project, I ran Docker through WSL rather than Docker Desktop, which can be installed directly in your WSL terminal:
bashsudo apt install docker.io
sudo service docker startThe biggest concern with our Docker container is data persistence. If you spin up a container, configure your dashboards, and then tear it down without a named volume, you'll lose your dashboard. To handle this, we use a named volume (grafana-storage) to persist Grafana's internal data — dashboards, data source config, plugins, and password — so nothing gets wiped on a container restart.
To make standing up our environment quick and reproducible, we need to create a docker-compose.yml file in the project folder to map our ports, volume mounts, and restart behavior.
/mnt/c instead of C:\services:
grafana:
image: grafana/grafana
container_name: grafana
ports:
- "3000:3000"
volumes:
- grafana-storage:/var/lib/grafana
- /mnt/c/Users/YOUR_USERNAME/YOUR_PROJECT_PATH/youtube_stats.db:/data/youtube_stats.db
restart: unless-stopped
volumes:
grafana-storage: {}One gotcha worth calling out — initially when trying to connect to the SQLite database I kept getting a "file not found" error. After some digging, I found the issue was a volume mount conflict. I was trying to mount the database file into /var/lib/grafana/ — the same directory the named volume owns. Docker's named volume was taking precedence and hiding the file mount. The fix was moving the database mount to a separate path /data/youtube_stats.db outside the named volume's directory.
Step 6: Adding the SQLite Plugin to Grafana
Grafana doesn't natively support SQLite, so we need to install the frser-sqlite-datasource community plugin. Run the following commands in WSL:
sudo docker exec -it grafana /bin/bash -c "grafana-cli plugins install frser-sqlite-datasource"
sudo docker restart grafana
Once the plugin is installed and the container has restarted, navigate to http://localhost:3000 in your browser. Log in with the default credentials (admin / admin) — you'll be prompted to set a new password. After that you're ready to connect your data source and build the dashboard.
Step 7: Building the Grafana Dashboard
The first thing you'll need to do in Grafana is connect your data source. Navigate to Connections → Data Sources → Add new → SQLite and set the path to /data/youtube_stats.db.
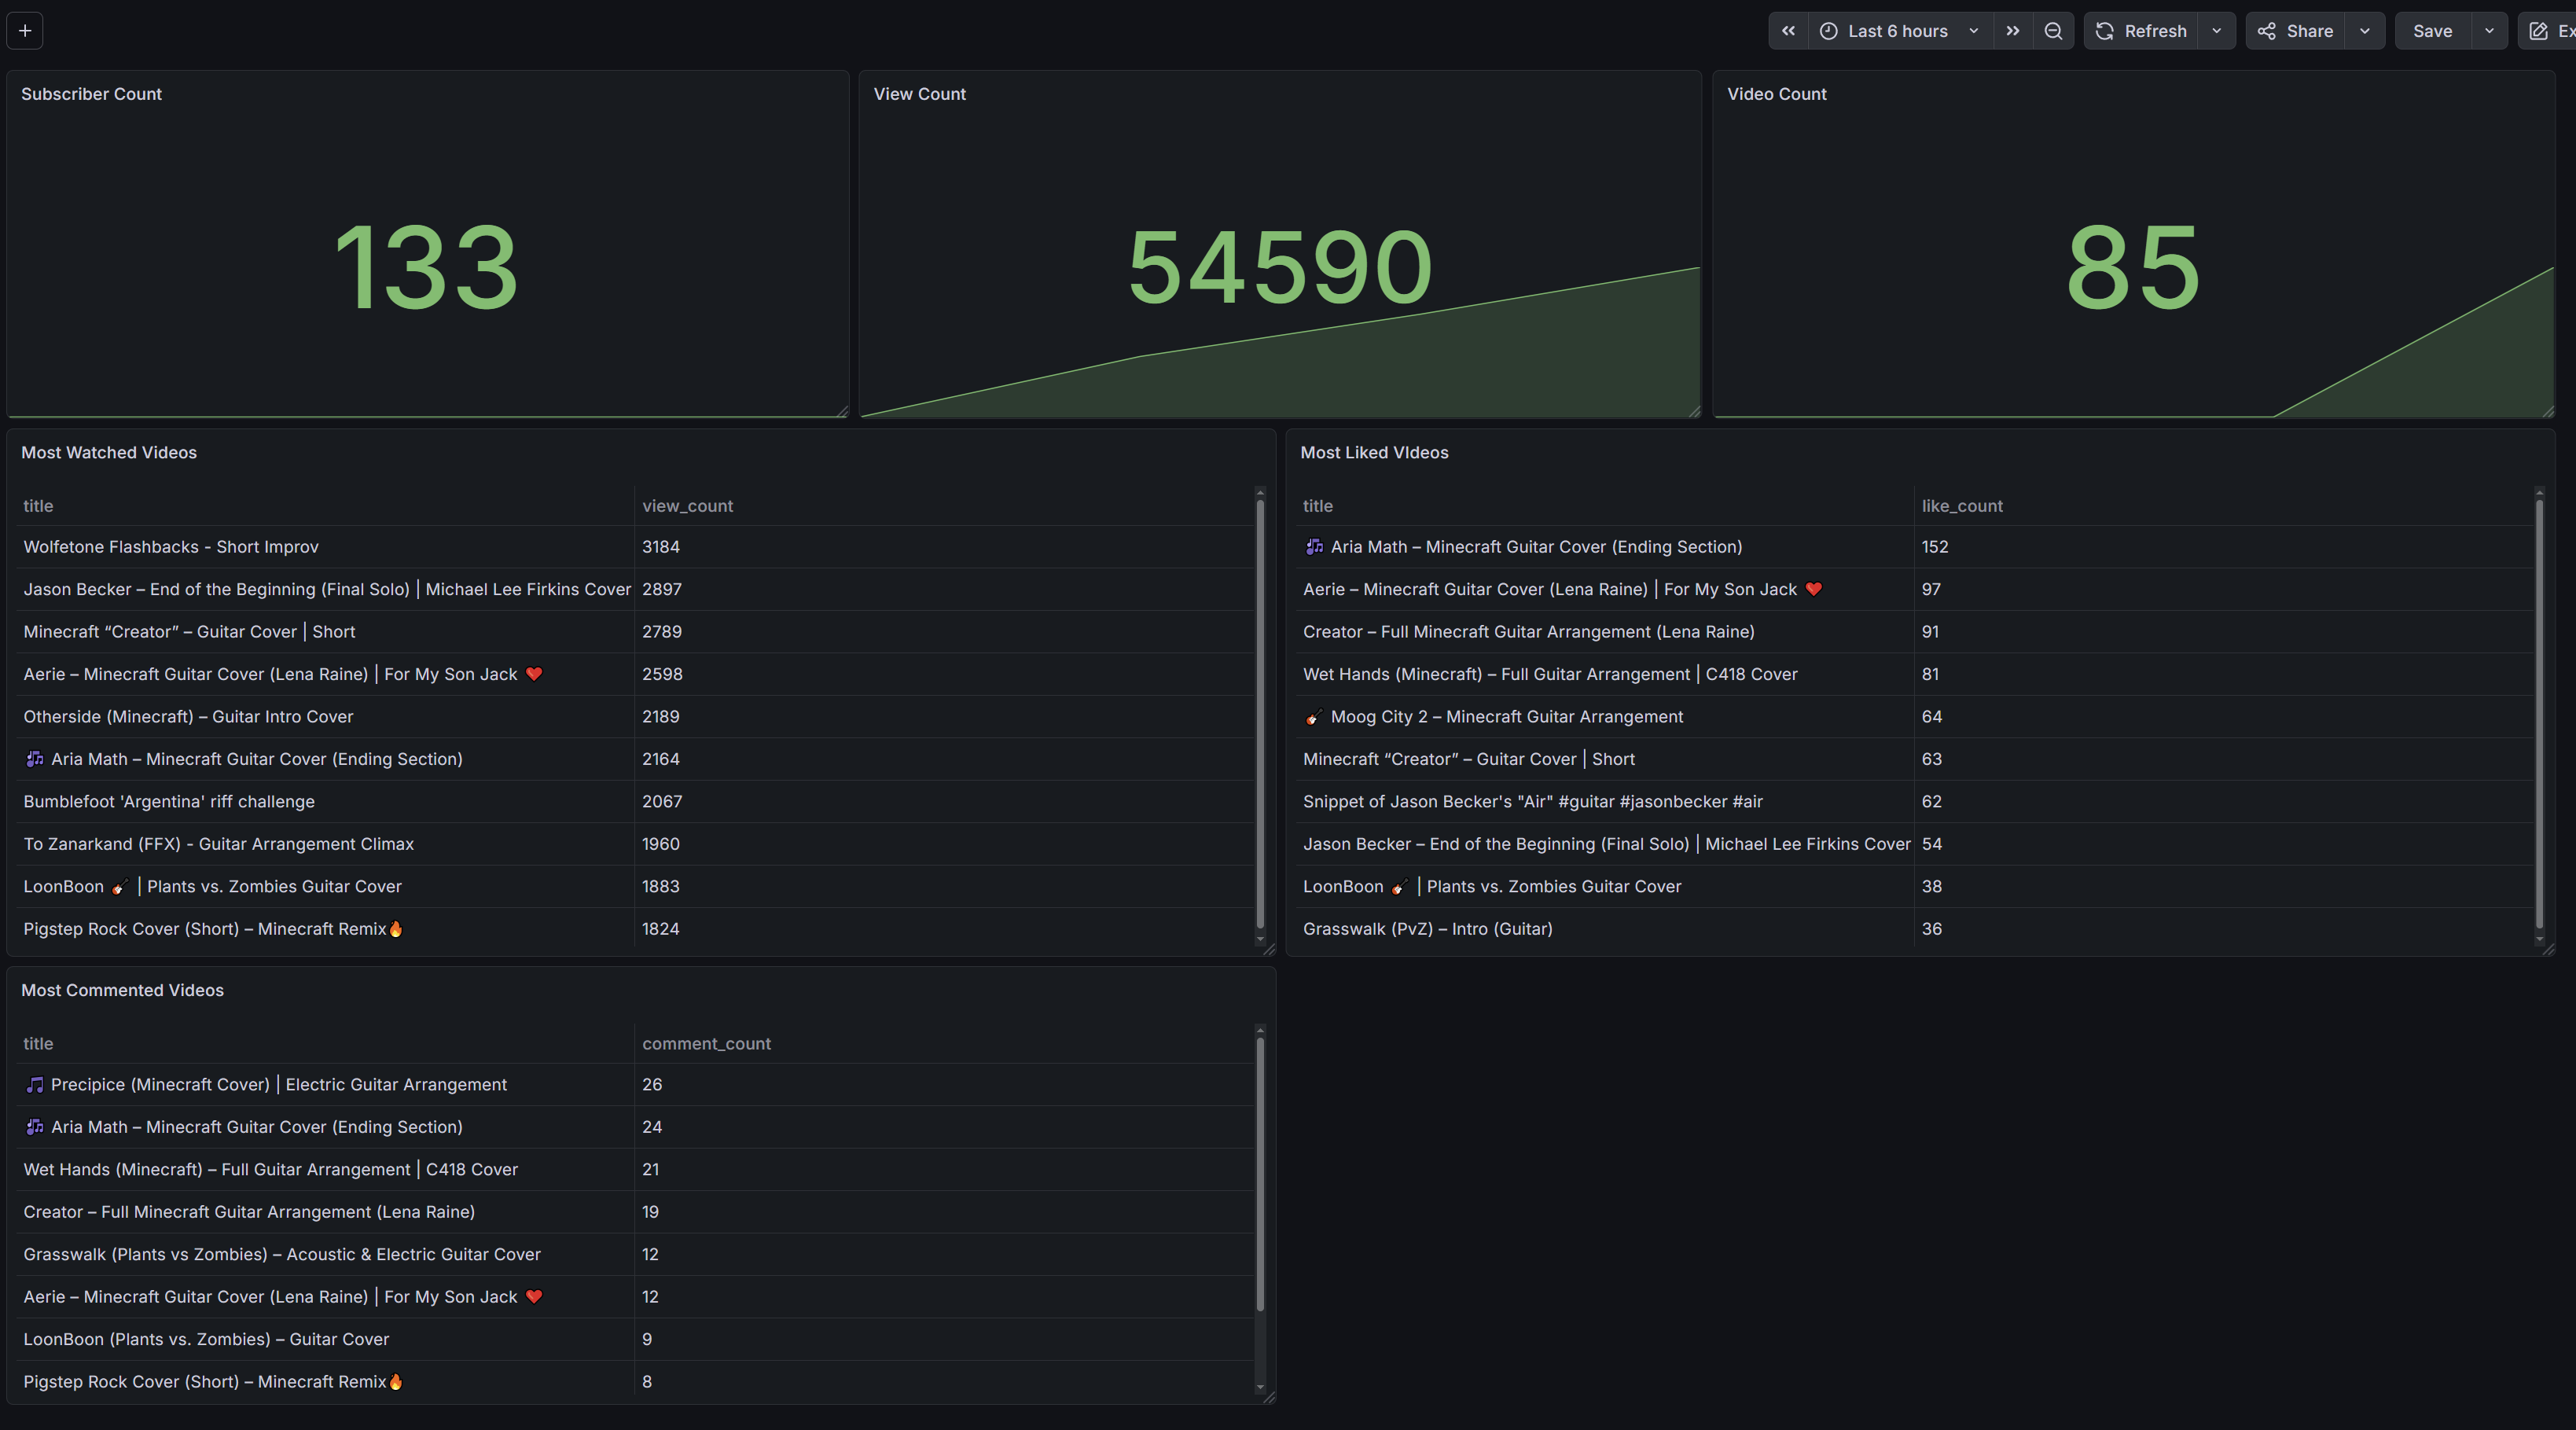
I built six visualizations based on the data being pulled through the API calls:
- Subscriber Count
- View Count
- Video Count
- Top 10 Most Watched Videos
- Top 10 Most Liked Videos
- Top 10 Most Commented Videos
Since these break into two similar groups, I'll walk through one example of each. You could of course choose different visualizations, and as you collect more data over time additional chart types will allow even more observability.
Visualization #1: Stat Tiles (Channel Totals)
The same setup applies to our Subscriber Count, View Count, and Video Count panels. Go to the Dashboards tab, select New Dashboard, and add a panel. In the data source dropdown you should see your database listed. For these metrics select the Stat visualization type under All Visualizations.
Once your Stat panel is open, scroll down to the query section at the bottom of the editor. This is where you will enter the SQL queries to pull data from your SQLite database.
The query to pull view count is straightforward. One consideration is how the Stat Tile handles historical data — with each nightly update you'll see not just the current count but also a sparkline in the background showing growth over time. By modifying the query, you can limit this to a specific time range. I have mine set to a rolling 30-day window:
sqlSELECT timestamp, view_count FROM channel_stats
WHERE timestamp >= date('now', '-30 days')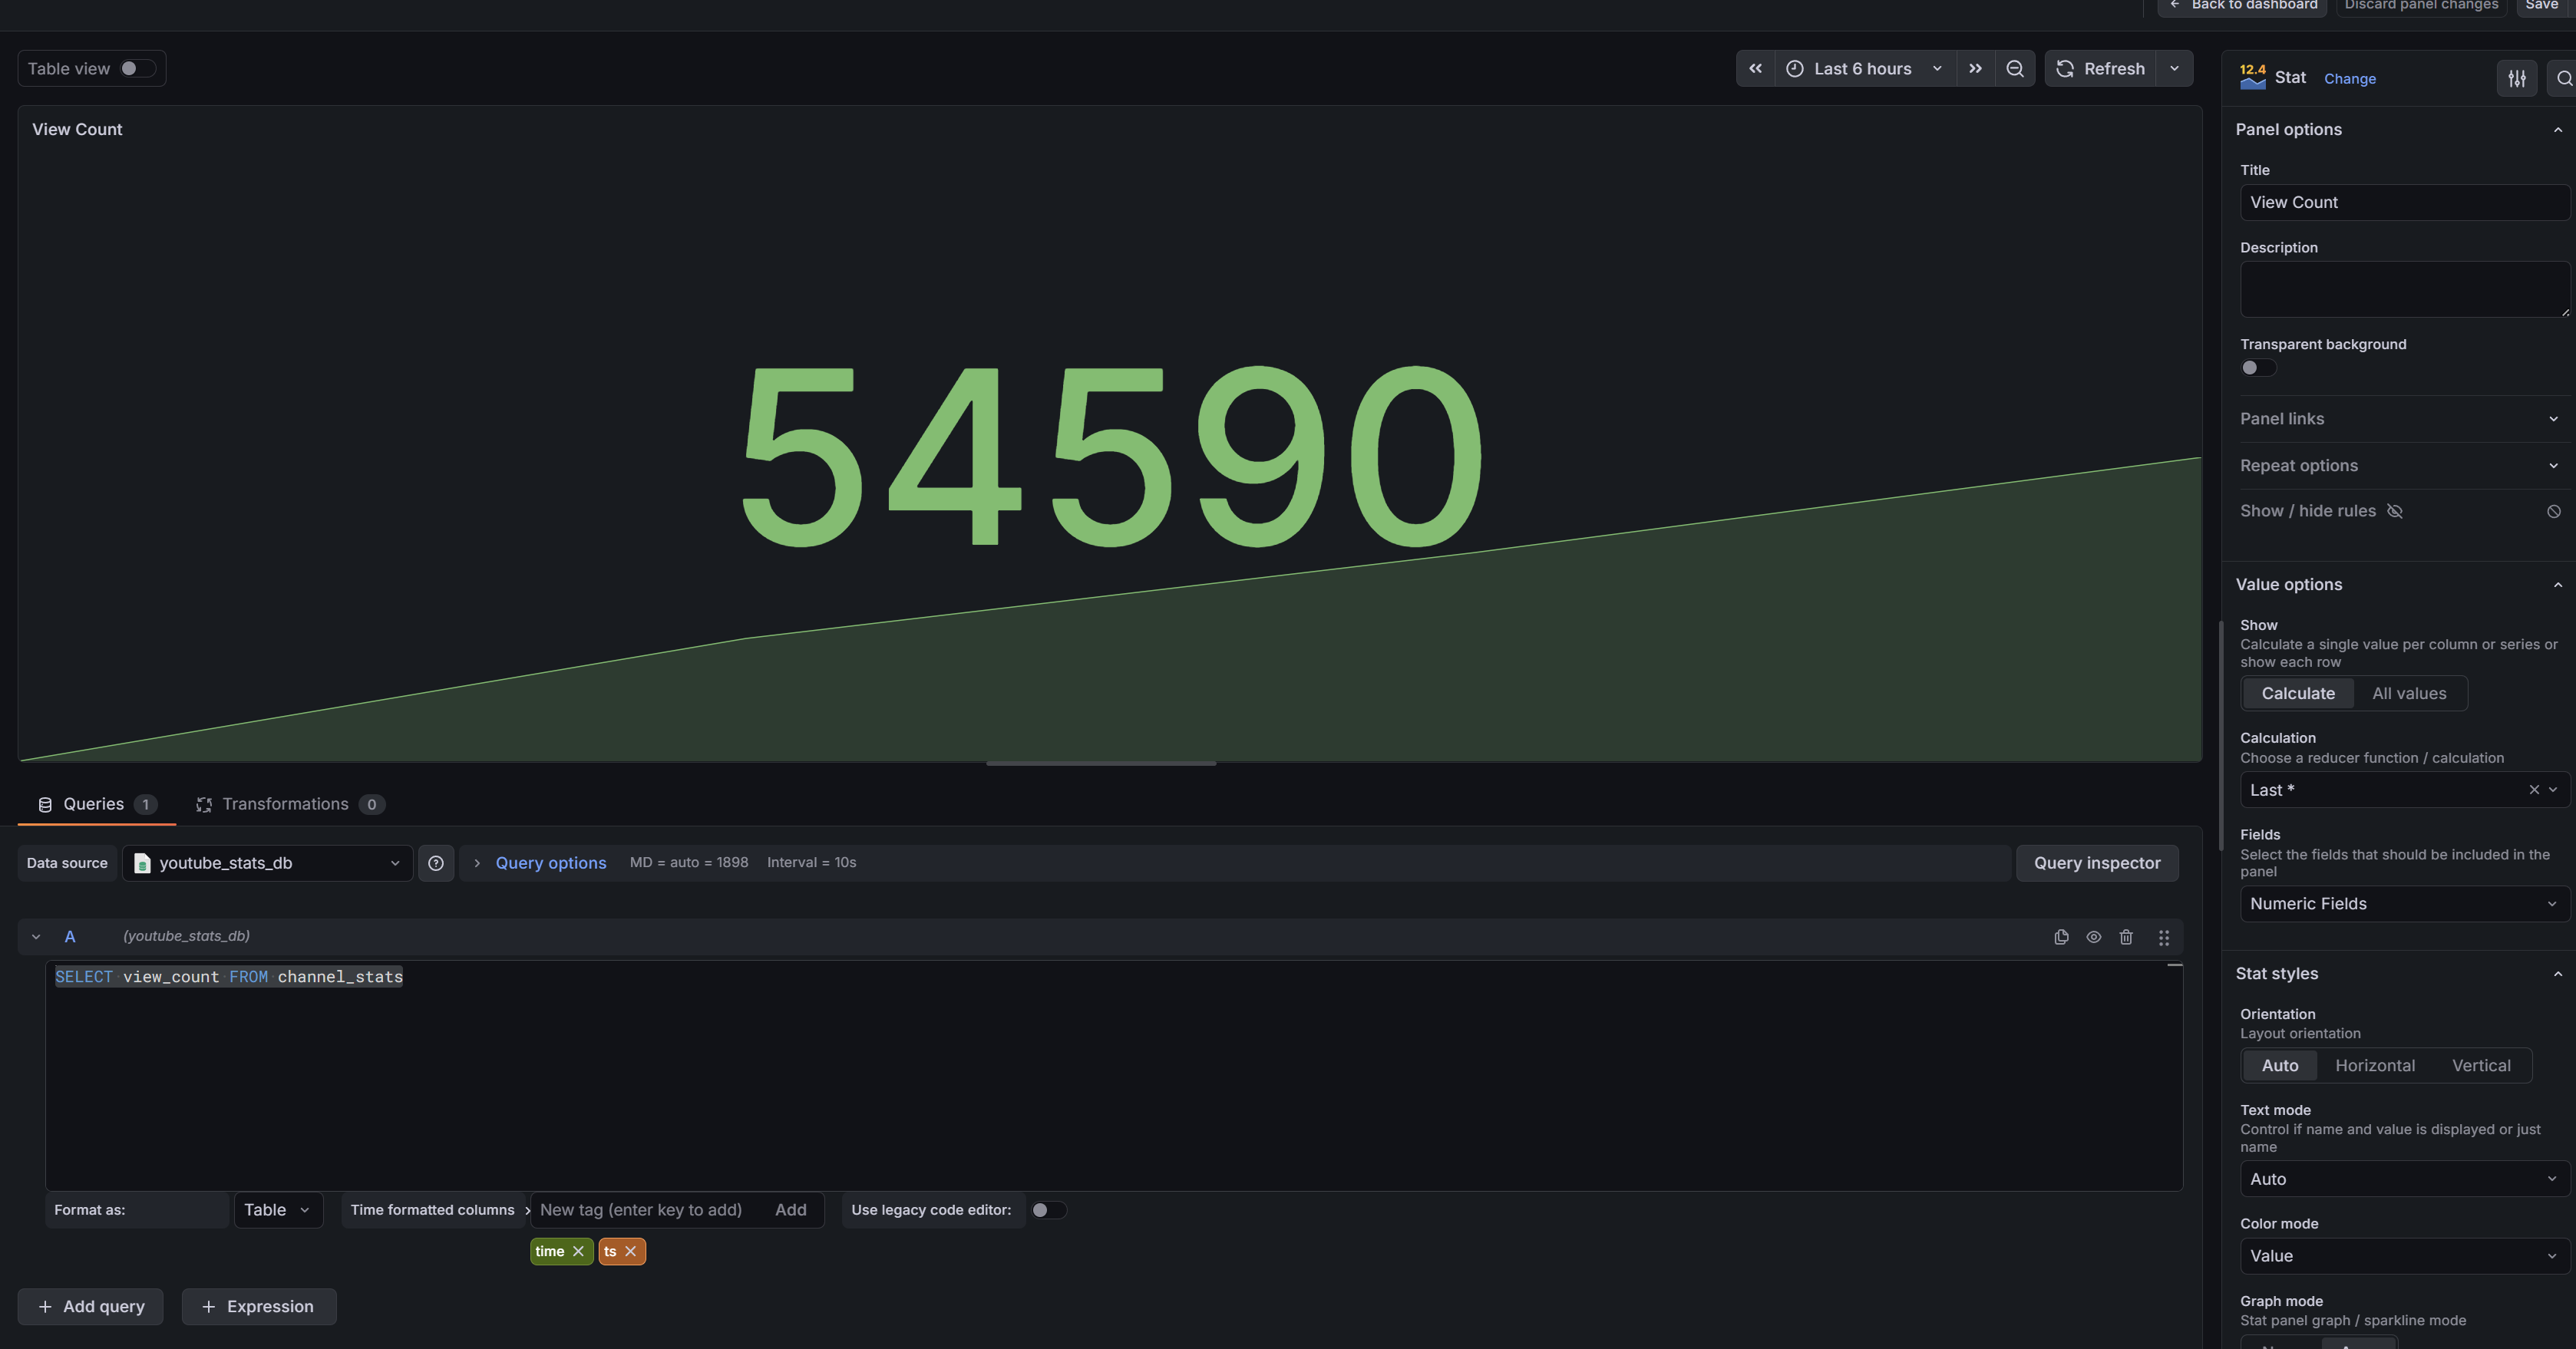
Visualization #2: Tables (Top Ten Lists)
For Most Watched, Most Liked, and Most Commented videos I used the Table visualization type. Follow the same steps to add a panel but select Table instead of Stat.
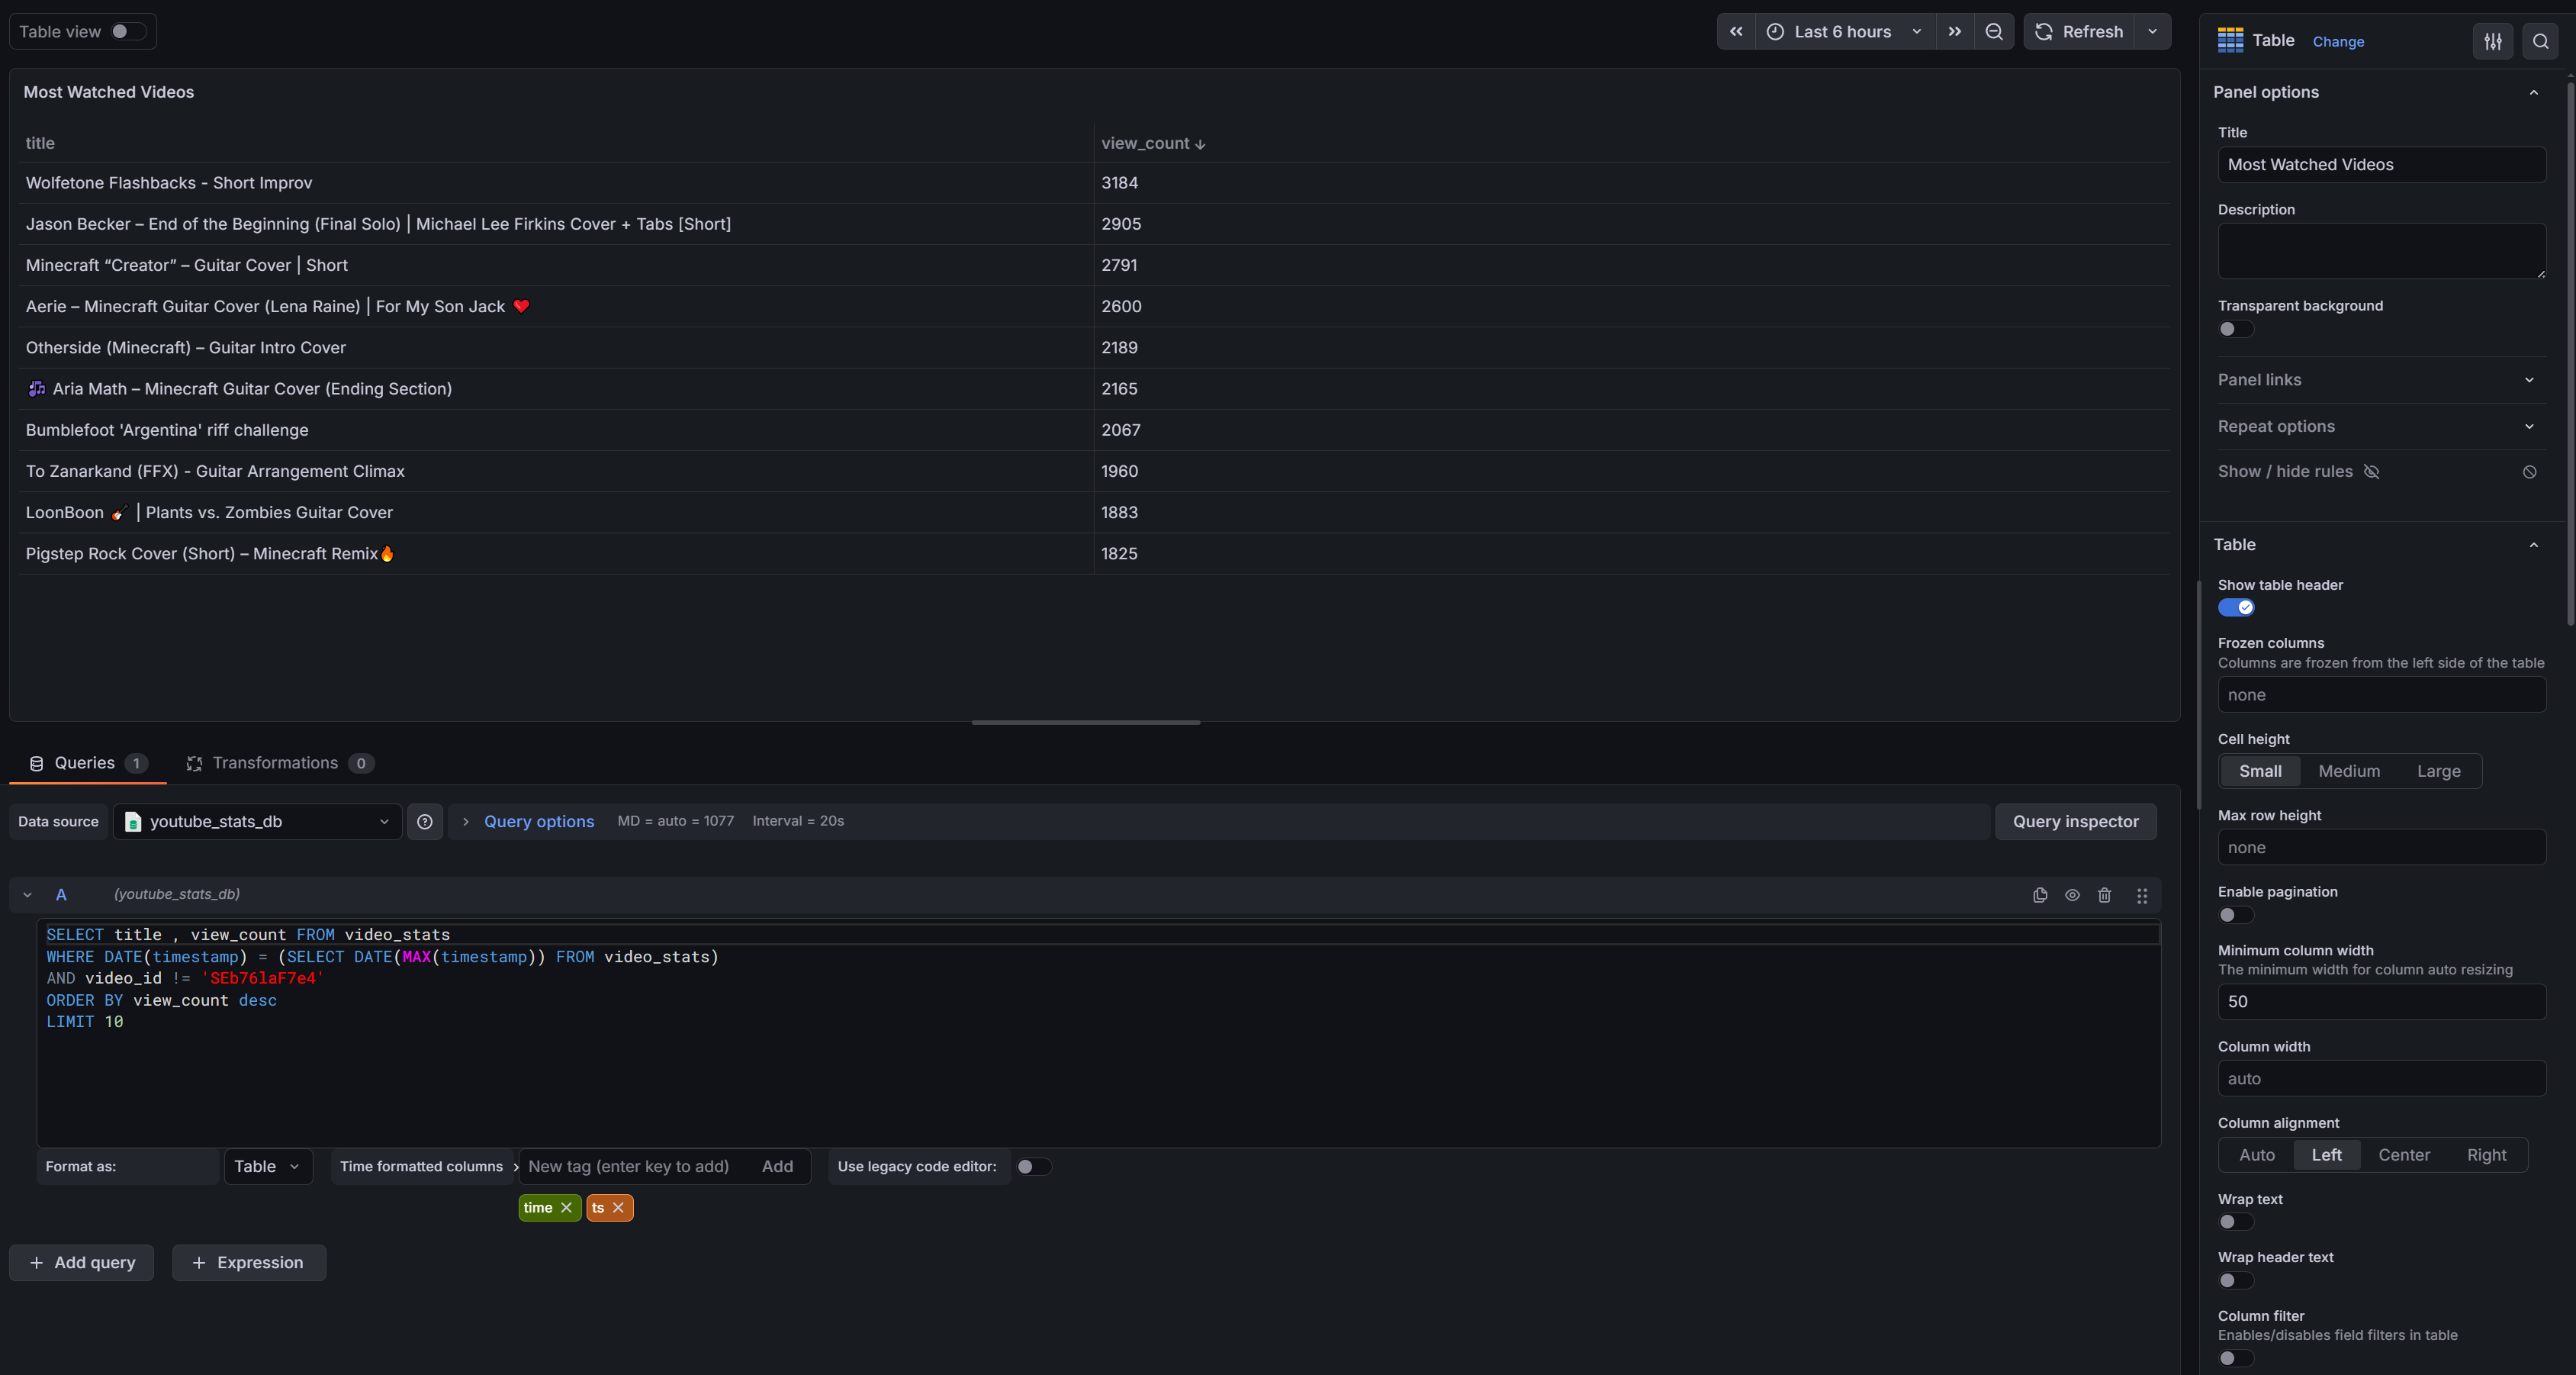
This time our query pulls from video_stats. Since we collect stats daily we need to limit results to the most recent snapshot — otherwise duplicate rows would pollute the results. We handle this by filtering to the latest date in the table using WHERE DATE(timestamp) = (SELECT DATE(MAX(timestamp)) FROM video_stats). One benefit of using MAX(timestamp) rather than today's date is that if the nightly script fails or your machine is off, the dashboard still shows the last successful snapshot instead of going blank.
SELECT title, view_count FROM video_stats
WHERE DATE(timestamp) = (SELECT DATE(MAX(timestamp)) FROM video_stats)
AND video_id != 'SEb76laF7e4'
ORDER BY view_count DESC
LIMIT 10
You'll also notice the AND video_id != 'SEb76laF7e4' line. My most watched video is an old gear demo that I've since set to private — I wanted to exclude it and only show current active videos in the results.
After adding in all the visualizations, we have a working dashboard displaying key YouTube analytics for our channel.
Final Step: Nightly Automation via Task Scheduler
To keep the dashboard current without manually triggering runs we can set up a simple nightly task via Windows Task Scheduler.
Open Task Scheduler and click Create Task. Under the Action tab configure the following:
- Program/script:
C:\Path\To\Python\python.exe - Arguments: full path to your script, e.g.
C:\Users\YOUR_USERNAME\YOUR_PROJECT_PATH\YT-GrafanaAPI.py - Start in: your project folder path — this is critical, it tells the script where to find
token.jsonandclient_secret.json
Under the Trigger tab set your preferred schedule — I have mine set to run at 2AM.
Also make sure to enable Task History so you can verify the nightly run is completing successfully. In Task Scheduler click Task Scheduler Library in the left panel, then in the right Actions panel click Enable All Tasks History.
One other thing worth noting — the Python script writes directly to the SQLite file on your Windows filesystem. Grafana plays no part in that process, so even if your Docker container is offline the data keeps accumulating. When you bring the container back up all the historical data will be there waiting in your visualizations.
With that the automated pipeline is complete — a fully automated dashboard displaying your YouTube stats with zero ongoing manual effort.
What's Next?
You might want additional visualizations, more data points from the YouTube Analytics API, or a different chart type as your historical data grows. For me, Phase 2 is already in the planning stages. The end goal is moving this local setup to the cloud — which will require migrating from SQLite to PostgreSQL and connecting to Grafana Cloud — allowing me to embed a live dashboard directly on my website.
I'm also planning to build an MCP server tied to this data, which will allow AI integration for deeper insights on my channel stats. More on both of those in a future post.